

vv1.0.1 · Apache-2.0 · GitHub

heaptide finds memory leaks in a running program without rebuilding it. It covers CPU code in C and Mojo, HIP code on AMD GPUs, and Python. One run produces one report, and the report answers five questions: what was never freed, whether live memory keeps rising after setup, which code holds memory now, which sites allocate most often, and which allocations are freed straight after they are made.
The problem
Most leak checkers need a rebuild, a slow run, or both. Valgrind's memcheck runs every instruction on a software CPU. On an allocation-heavy loop in our benchmark it was 48 times slower than heaptide. heaptrack is faster, but it streams every event to a second process, and it does not follow GPU memory.
GPU memory is the harder case. The ROCm runtime keeps its own pools, so a host-side tool can report a fixed block as a leak, or miss a real one. heaptide was built for mixed programs: a C host that launches HIP kernels, or a Mojo engine that allocates device buffers.
How it works

heaptide is a preload library, libheaptide.so, that the heaptide wrapper injects into the target. The library hooks the malloc family, anonymous mmap, munmap and mremap, the HIP allocation calls, and dlsym for Mojo's HIP path. For each allocation it unwinds the call stack, maps the stack to a small id, and writes a 16-byte entry in a live table. Counters are kept per call site and per thread, so threads do not share a hot lock.
At exit, a reachability scan runs with the LeakSanitizer design. The roots are globals, the stacks and registers of other threads, and linker blocks. Every block that was never freed is then classed as direct, indirect (only a lost block points to it), or reachable (still held through a root). The result is written to heaptide.<pid>.bin. The report is a separate Mojo program that resolves file and line with one batched llvm-symbolizer call.
What it does
run: starts a command under the hooks.--gputurns off Mojo's device memory pool so each buffer is its own block.--pycharges each Python allocation to its source line.--every MSsets the growth sampling period.run --snapshot-every S: writes a report on a timer while the program runs.run --gpu-timeline PARTS: draws VRAM per call site over the run, with views for streams and fragmentation.run --no-childrenand--only NAME: choose which child processes are traced.snapshot DIR: makes a running traced process write its report now, with an optional--label.report DIR: prints LEAKS, GROWTH, PEAK, HOTSPOTS and TEMPORARIES, and PYTHON with--py.--json,--top,--suppand--growth-limitshape the output, and--fail-onsets the exit code.diff BASE NEW: matches sites by their function chain, not their line numbers, and fails on a new leak site.--fail-on grownalso fails on growth, so it can gate a CI job.flame DIR: writes one offline HTML page with every call path as a flame graph. It switches between leaked, live, peak, allocated and temporary bytes.attach PIDanddetach DIR: load into a running process through gdb, and take it back without a restart.
Numbers

Benchmark: bench/alloc_bench.c, eight threads each doing one million malloc and free calls on sizes from 16 to 4096 bytes, on a Ryzen 7 7800X3D with the arms interleaved over eight rounds.
| tool | wall time | peak memory added over bare |
|---|---|---|
| bare | 0.02 s | none |
| heaptide | 0.13 s (median) | 9.3 MB |
| heaptrack 1.5.0 | 1.65 s (median) | 62.1 MB |
| Valgrind massif | 1.97 to 1.99 s | 29 to 33 MB |
| Valgrind memcheck | 5.55 to 5.68 s | 81 to 85 MB |
On a Python benchmark with 8 million live objects and 17 million allocations, heaptide took 2.9 s and 849 MB, against 2.8 s and 617 MB for memray and 0.9 s and 569 MB bare. Even so, on an allocation-bound loop heaptide is still about six times slower than no tool at all.
The test suite runs 239 checks against planted bugs, with heaptrack and LeakSanitizer as oracles. tests/run.sh --cpu runs the 234 that need no GPU, and CI runs those on Ubuntu 24.04 on every push.
Install and first run
The release tarball needs no Mojo. It needs Linux on x86-64, glibc 2.34 or newer, and libunwind:
curl -LO https://github.com/amarbarosys/heaptide/releases/download/v1.0.1/heaptide-v1.0.1-linux-x86_64.tar.gz
tar xzf heaptide-v1.0.1-linux-x86_64.tar.gz && cd heaptide-v1.0.1-linux-x86_64
./heaptide run -- CMD...
To build from source you need a C compiler, libunwind, and Mojo 1.2 or newer for the report. Then ./build.sh produces build/libheaptide.so and build/heaptide_report.
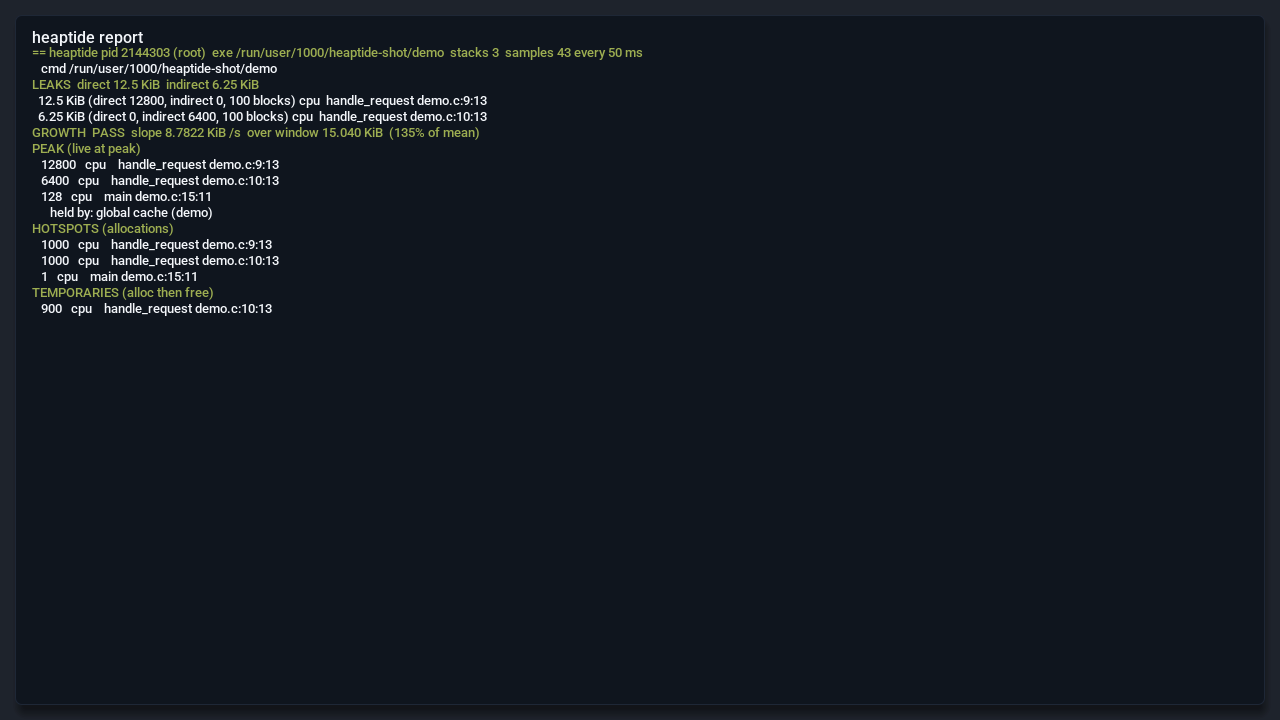
The demo in examples/demo.c loses one 128-byte node, and the 64-byte block it points to, on every tenth of 1000 requests:
cc -O0 -g -o demo examples/demo.c
./heaptide run --every 50 -- ./demo
./heaptide report .work/heaptide --top 3
The report shows 12.5 KiB direct and 6.25 KiB indirect, both at demo.c:9 and demo.c:10, and exits 1 because there are leaks. Build with -g to get file and line numbers.
Limits
- Linux x86-64 only. The GPU paths were tested on one machine, with an RX 7900 XTX and ROCm 7.2. Other GPUs are untried. Windows has no native build. WSL2 works for Linux programs.
- A pointer into the middle of a block keeps that block alive, as in LeakSanitizer, so a stray word can hide a leak.
- GPU and pinned host blocks are never scanned, because the HIP runtime's own tables point at them. Any such block still allocated at exit counts as a direct leak.
- After SIGKILL or the OOM killer there is no leak scan. The report says so and shows what the process held.
- Mojo's own allocator is switched to libc at start. An attached process is different:
attachcannot see Mojo's heap. - An attached report has no GROWTH verdict, and it can under-report, because memory allocated before attach is treated as a root.
heaptide --helpprints only the usage line.docs/api.mdlists every subcommand and flag.
The internals are in docs/how-it-works.md, the design choices in docs/design.md, and the file format in docs/file-format.md. The repository also ships a skill folder for coding agents in skills/heaptide/.
heaptide is public on GitHub at https://github.com/amarbarosys/heaptide under the Apache-2.0 license. The latest release is v1.0.1, published on 2026-11-14.