

vv1.0.0 · Apache-2.0 · GitHub

corewait is a per-instruction stall profiler for CPU code. It records hardware counters while a program runs, joins the samples to the disassembly, and gives each instruction row a cause: memory, branch, dependency, front end, or busy. It works on a desktop, a laptop, and Android phones.
The problem
A profiler that lists hot functions does not say why an instruction is slow. For a loop on a phone, the cause decides the fix. A load that misses cache needs a different change from a dependency chain the core cannot overlap. corewait names the cause on every row, and its diff and budget commands keep a fix from silently coming back.
How it works

corewait record runs the program under perf on Linux, or under simpleperf on the phones. It samples cycles and the memory and branch events, and it runs the program a second time to count whole-run totals. The output is samples.tsv, stat.tsv, objdump.txt and meta.txt.
A sample lands a few instructions after the instruction that stalled. So each row's cycles and events go to the nearest preceding load or branch, up to K rows back. Then the first matching cause wins, in this order: mem, branch, dep, fe, busy. An event counts for a row only if it has at least 10 samples, and only if its share of the event is at least half its share of the cycles.
The dep rule covers a non-load row that reads its own destination, such as fmla v0.4s, v0.4s, v3.4s or add rax, rcx. A zero idiom such as xor eax, eax does not count.
The device table is at the top of corewait. Each device has its own counters. The laptop uses perf. The phones use simpleperf in user space only, with the :u events.
What it does
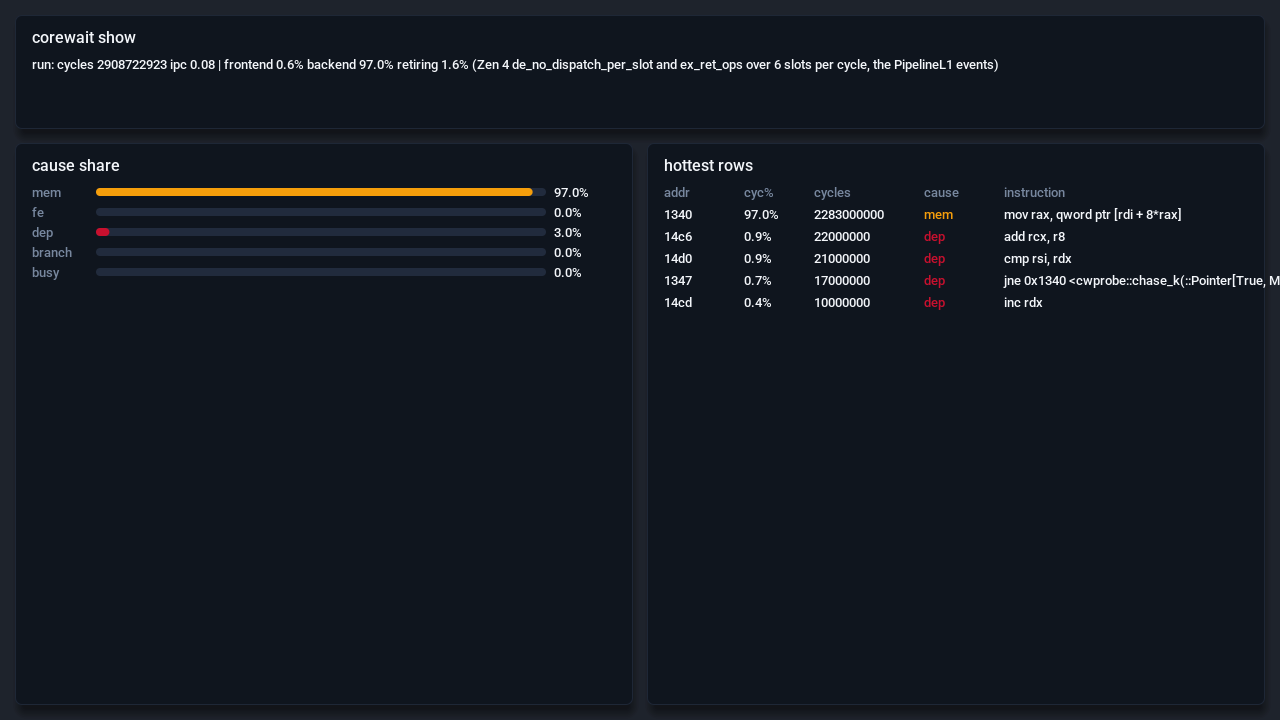
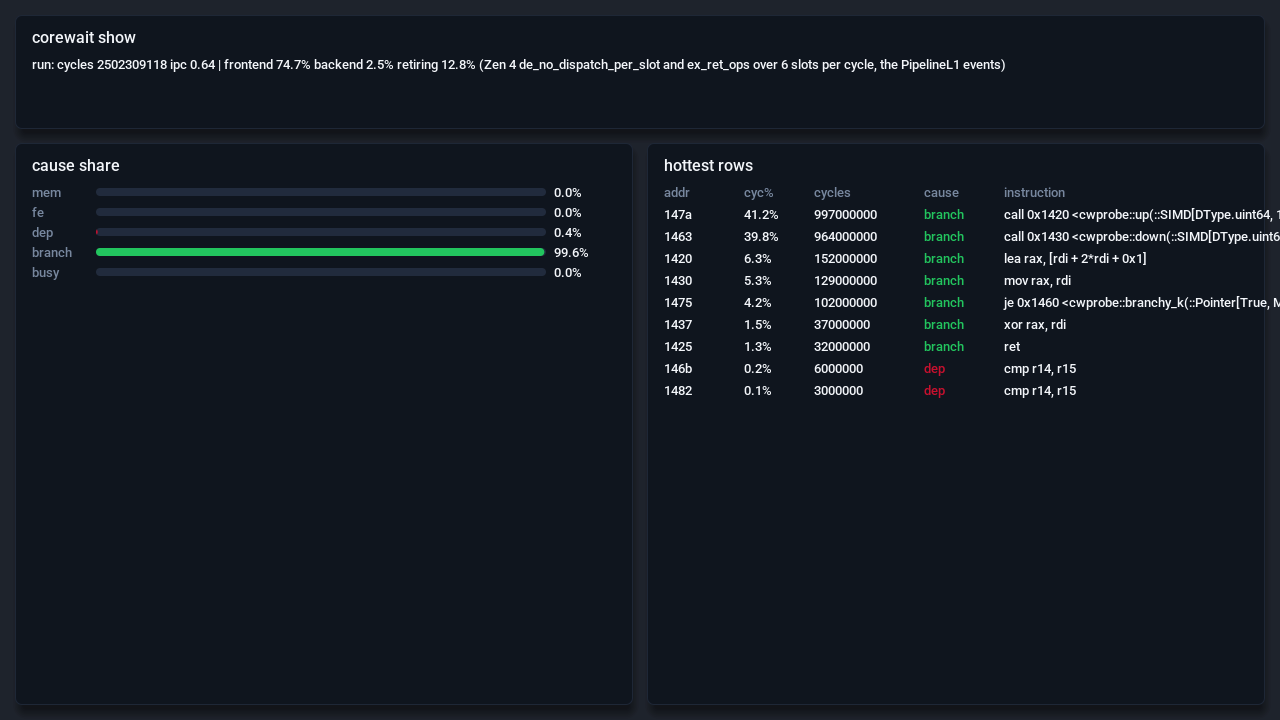
corewait build DEV: cross-compiles the probe for the device, so the device needs no Mojo runtime.corewait record DEV OUT -- [K=V ...] BINARY [ARGS]: profiles one command.--dso LIBor--dso autoreports one loaded library of a host process such as Python.--pid PIDsamples a running server.--no-statskips the second run.corewait pick OUT LIB|auto: reports another library of an existing recording without a new run.corewait show OUT: one row per instruction, with cycles, events, cause and text.--top,--causes,--fn SYMBOLand--kshape it.--bytesand--bwadd a line that compares achieved bandwidth with the measured device bandwidth.corewait diff OUT_A OUT_B: the per-row cycle change. Rows of same-named functions are aligned by their text, with register names masked, and the memory stays linear in the number of rows.corewait budget OUT FILE: a CI gate. Each line ofFILEisfn cause max-percent, and a breach exits 1.corewait merge OUT DIR...: adds repeated recordings of one binary.CW_DIV=20shortens the sampling period for a kernel that runs for 40 ms.corewait stat DEV OUT: rebuildsstat.tsvfrom the raw counters.corewait bw DEV: sequential read bandwidth with 1, 2, 4 and all concurrent stream probes.probes/cwprobe.mojo: four probes (chase, stream, fmachain, branchy), each about half a second, each with one dominant cause.check-live.sh DEVchecks the top cause of each probe on a device.
Numbers

Sequential read bandwidth, from docs/DEVICES.md:
| device | CPU | 1 thread (GB/s) | all threads (GB/s) |
|---|---|---|---|
| desktop | Ryzen 7 7800X3D, 16 threads | 49.3 | 55.5 |
| laptop | i5-6200U, Skylake, 4 threads | 16.5 | 27.5 |
| flip | Galaxy Z Flip4, six usable CPUs | 13.0 | 46.9 |
| xiaomi | 17 Ultra, Oryon, 8 CPUs | 72.5 | 66.6 |
| oneplus | 7T Pro, A76 and A55 | 15.8 | 19.4 (6 threads) |
On a desktop, the single-thread figure ranged from 46.0 to 57.7 GB/s over five runs, with other sessions loading the machine.
A worked case from ComfyUI, measured on 2026-11-02 with ComfyUI v0.43.0 and a 400,000-query point workload: query_single_point took 98.2% of the cycles in _ckdtree, and _ckdtree was 23.5% of the run. The OpenBLAS idle spin loop took 58% of the run's cycles across two libraries. Setting OPENBLAS_NUM_THREADS=1 removes that spin. This was measured on the offline workload, not on a live ComfyUI server.
Diffing two of the 1.1 GB disassembly files from a Mojo kernel took 4.5 s and 59 MB, after the reader was changed to read in 8 MB chunks and cut long lines to 4096 bytes. Before that change the same diff took 36 s and 5.7 GB.
The CPU-only gate is ./check.sh. It builds the probe, records a smoke run, compares the golden fixtures, runs a planted mutant, times a million-row file, and checks bad input and register roles.
Install and first run
Record a command on the desktop:
corewait build desktop
corewait record desktop OUT -- BINARY ARGS
corewait show OUT --top 10 --causes
To profile a Python job, such as ComfyUI, add --no-stat, or use --pid on a server that is already running:
corewait record desktop OUT --no-stat -- .venv/bin/python job.py
corewait record desktop OUT --pid SERVER -- sleep 60
Read dsos.tsv first. It ranks every library the process loaded, so you can see where the time went before you pick one with corewait pick.
Limits
- The desktop runs at perf's paranoid level 2, so corewait records only user-space events, written
:u, and needs no root. - Phones are profiled from a command the tool starts, through
adb, with user-space events. A phone is locked whilerecordorbwuses it, so two runs do not share it. - A sample lands a few instructions after the stall, and the cause is a rule applied to that position. Treat a single row's cause as a pointer, and check the top causes against the probes.
- The Xiaomi recording and a fresh bandwidth run are pending. Its bandwidth numbers were taken before the phone dropped off wifi.
- A BLAS or OpenMP pool spins while it waits, and the spin can top a profile with no real work behind it. Set the thread count to 1, or pick the library you care about.
- Large libraries are slow to disassemble.
libtorch_cpu.so, at 440 MB, adds about 50 s. - Not tested on a live ComfyUI server, or on libtorch samples.
corewait is public on GitHub at https://github.com/amarbarosys/corewait under the Apache-2.0 license. The v1.0.0 release, dated 2026-11-07, was published as one squashed commit. Its design notes are in docs/design.md, and the full command reference is in docs/api.md.